John Marshall Bancorp, Inc. Reports 10th Consecutive Quarter of Record Earnings
Strong Momentum and Growth Continue
RESTON, VA–(BUSINESS WIRE)–John Marshall Bancorp, Inc. (OTCQB: JMSB) (the “Company”), parent company of John Marshall Bank (the “Bank”), reported its financial results for the three and six months ended June 30, 2021.


Selected Highlights
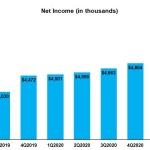
- Tenth Consecutive Quarter of Record Earnings – The Company reported net income of $6.1 million for the three months ended June 30, 2021, a 33.3% increase over the $4.6 million reported for the three months ended June 30, 2020. The Company reported net income of $11.2 million for the six months ended June 30, 2021, a 23.1% increase over the $9.1 million reported for the six months ended June 30, 2020. Earnings per diluted share for the three months ended June 30, 2021 were $0.44, a 33.3% increase over the $0.33 reported for the three months ended June 30, 2020. Earnings per diluted share for the six months ended June 30, 2021 were $0.80, a 21.2% increase over the $0.66 reported for the six months ended June 30, 2020. Return on average assets was 1.20% and return on average equity was 12.64% for the three months ended June 30, 2021. Return on average assets was 1.13% and return on average equity was 11.78% for the six months ended June 30, 2021.
- Strong Growth – Year-over-year total assets increased 14.6% or $263.3 million to $2.07 billion at June 30, 2021. Gross loans net of unearned income increased $49.5 million or 3.3% from June 30, 2020 to June 30, 2021. Gross loans net of unearned income and Paycheck Protection Program (“PPP”) loans grew $115.4 million or 8.4% from June 30, 2020 to June 30, 2021. Total deposits grew $253.4 million or 16.2% from June 30, 2020 to June 30, 2021. Non-interest bearing demand deposits grew 20.1% or $80.0 million from June 30, 2020 to June 30, 2021.
- Asset Quality Remains Pristine – For the seventh consecutive quarter, the Company had no non-performing loans and no other real estate owned at quarter-end June 30, 2021. As of June 30, 2021, the Company had no loans more than 15 days past due. The Company had $90 thousand and $91 thousand in charge-offs during the three months and six months ended June 30, 2021, respectively, compared to no charge-offs during the same periods in 2020. Troubled debt restructurings were $473 thousand at June 30, 2021, a decrease of $160 thousand, from $633 thousand at June 30, 2020. The Company had no COVID modifications as of June 30, 2021. The Company believes its allowance for loan losses is appropriate for the inherent risks and uncertainties associated with the portfolio.
- Net Interest Margin Increased from 2Q 2020 and 1Q 2021 – The net interest margin was 3.31% for the three months ended June 30, 2021, an increase of 4 basis points from the three months ended June 30, 2020. On a linked quarterly basis, net interest margin, excluding PPP loans, increased 7 basis points from 3.25% for the quarter ended March 31, 2021 to 3.32% for the quarter ended June 30, 2021.
Chris Bergstrom, President and Chief Executive Officer, commented, “Despite the economic headwinds we have faced over the course of the past year, John Marshall continues to produce record earnings while investing for our future growth. We have a well-capitalized balance sheet, ample liquidity, excellent asset quality and a strong loan pipeline. Our net interest margin has been stable and our ratio of overhead expense to average assets compares favorably to the industry. We are well-positioned as the economic outlook continues to improve.”
Balance Sheet Review
Assets
Total assets were $2.07 billion at June 30, 2021, $1.89 billion at December 31, 2020 and $1.80 billion at June 30, 2020. Year-over-year asset growth from June 30, 2020 to June 30, 2021 was $263.3 million or 14.6%. Year-to-date asset growth from December 31, 2020 to June 30, 2021 was $180.4 million or 19.3% annualized. During the second quarter of 2021, assets increased $55.9 million or 11.2% annualized.
Loans
Gross loans were $1.57 billion at June 30, 2021, $1.56 billion at December 31, 2020 and $1.52 billion at June 30, 2020. Gross loans net of unearned income increased $49.5 million or 3.3% from June 30, 2020 to June 30, 2021. Excluding PPP loans, gross loans net of unearned income increased $115.4 million or 8.4% from June 30, 2020 to June 30, 2021. Gross loans net of unearned income grew $4.6 million or 0.6% annualized, during the six months ended June 30, 2021 and decreased $38.7 million during the three months ended June 30, 2021.
Excluding the impact of PPP loans, gross loans net of unearned income grew $36.8 million, 5.1% annualized, during the six months ended June 30, 2021 and decreased $4.2 million during the three months ended June 30, 2021. The decrease in the non-PPP loan portfolio during the quarter was primarily due to an unusually high volume of payoff and pay down activity. During the second quarter of 2021, the Bank experienced, in aggregate, $159.8 million of payoffs and pay downs or $64.4 million more than the trailing nine quarter average payoff and pay down volume of $95.4 million. The unusually high level of payoffs and pay downs masked the Bank’s second largest historical quarterly gross loan production, excluding PPP loans, of $156.1 million during the second quarter of 2021. Management believes the second quarter payoff and pay down activity to be anomalous. The Bank’s loan pipeline remains consistent with the trailing nine quarter average.
Investment Securities
The Company’s portfolio of investments in fixed income securities was $299.5 million at June 30, 2021, $151.9 million at December 31, 2020 and $127.7 million at June 30, 2020. Year-over-year bond growth from June 30, 2020 to June 30, 2021 was $171.8 million or 134.5%. The year-over-year and year-to-date increase in fixed income securities was funded by PPP loan payoffs and deposit growth.
Interest-Bearing Deposits in Banks
Interest-bearing deposits in banks were $158.7 million at June 30, 2021, $130.2 million at December 31, 2020 and $109.9 million at June 30, 2020. The Company expects to continue to reinvest these funds in higher yielding assets as opportunities and liquidity management allow.
Deposits
Total deposits were $1.82 billion at June 30, 2021, $1.64 billion at December 31, 2020 and $1.56 billion at June 30, 2020. Year-over-year deposit growth from June 30, 2020 to June 30, 2021 was $253.4 million or 16.2%. Deposits grew $174.9 million or 21.5% annualized during the six months ended June 30, 2021 and $53.6 million or 12.2% annualized during the three months ended June 30, 2021.
Non-interest bearing demand deposits were $478.7 million at June 30, 2021, $362.6 million at December 31, 2020 and $398.7 million at June 30, 2020. Year-over-year non-interest bearing demand deposit growth from June 30, 2020 to June 30, 2021 was $80.0 million or 20.1%. During the six months ended June 30, 2021, non-interest bearing deposits grew $116.1 million or 64.6% annualized, and $58.9 million or 56.3% annualized during the three months ended June 30, 2021. Non-interest bearing demand deposits represented 26.4% of total deposits at June 30, 2021, 22.1% of total deposits at December 31, 2020 and 25.5% at June 30, 2020.
Core customer funding (which includes reciprocal IntraFi Demand®, IntraFi Money Market® and IntraFi CD® deposits maintained by customers) was $1.56 billion at June 30, 2021, $1.40 billion at December 31, 2020 and $1.37 billion at June 30, 2020. Year-over-year core customer funding sources increased by $193.9 million or 14.2% from June 30, 2020 to June 30, 2021. Non-maturing deposits were 63.1% of total deposits as of June 30, 2021, 60.3% as of December 31, 2020 and 61.4% as of June 30, 2020.
IntraFi CD® certificates of deposits (formerly known as Certificate of Deposit Account Registry Service [CDARS]) were $60.8 million at June 30, 2021, $39.7 million at December 31, 2020 and $37.3 million at June 30, 2020. Year-over-year, IntraFi® certificates of deposits increased $23.4 million from June 30, 2020 to June 30, 2021.
Certificates of deposits were $356.7 million at June 30, 2021, $374.4 million at December 31, 2020 and $372.4 million at June 30, 2020. Year-over-year certificates of deposit decreased $15.7 million from June 30, 2020 to June 30, 2021. QwickRate® certificates of deposit were $31.5 million at June 30, 2021, $29.8 million at December 31, 2020 and $31.8 million at June 30, 2020. Year-over-year QwickRate® certificates of deposit decreased $283 thousand from June 30, 2020 to June 30, 2021. Brokered deposits were $220.4 million at June 30, 2021, $207.6 million at December 31, 2020 and $160.6 million at June 30, 2020. Brokered deposits increased $3.5 million from March 31, 2021 to June 30, 2021. Management continues to utilize wholesale funding in order to selectively realize lower funding costs and achieve certain asset/liability objectives.
Borrowings
Borrowings, consisting of Federal Home Loan Bank of Atlanta (“FHLB”) advances were $18.0 million at June 30, 2021, $22.0 million at December 31, 2020 and $26.0 million at June 30, 2020. FHLB advances decreased $8.0 million or 30.8% from June 30, 2020 to June 30, 2021 and decreased $4.0 million or 18.2% from December 31, 2020 to June 30, 2021. Management continues to retire FHLB advances as they mature to increase contingent funding sources. As of June 30, 2021, the Bank had approximately $283 million remaining in secured borrowing capacity with the FHLB, an increase of $41 million over the $242 million of FHLB secured borrowing capacity as of June 30, 2020.
The Company had subordinated notes with a balance of $24.7 million at June 30, 2021, December 31, 2020 and June 30, 2020.
Shareholders’ Equity and Capital Levels
Total shareholders’ equity was $195.2 million at June 30, 2021, $186.1 million at December 31, 2020 and $176.3 million at June 30, 2020. Year-over-year shareholders’ equity increased by $18.9 million or 10.7%. Accumulated other comprehensive income declined from $3.8 million at June 30, 2020 to $1.3 million at June 30, 2021. An increase in market yields for investments with maturities three years or longer has reduced the Company’s unrealized gains in its bond portfolio, as bond prices and yields vary inversely.
Total common shares outstanding increased from 13,573,601, including 47,403 shares relating to unvested stock awards, at June 30, 2020, to 13,639,173, including 60,995 shares relating to unvested stock awards, at June 30, 2021. The year-over-year increase in shares outstanding was the result of exercises of share options and additional grants of unvested stock awards.
The Bank’s capital ratios remain well above regulatory minimums for well-capitalized banks. As of June 30, 2021, the Bank’s total risk-based capital ratio was 15.0%, compared to 14.4% at June 30, 2020.
Asset Quality
As of June 30, 2021, the Company had no non-accrual loans, no loans more than 15 days past due and no other real estate owned.
Troubled debt restructurings were $473 thousand at June 30, 2021, a decrease of $160 thousand, from $633 thousand at June 30, 2020. All troubled debt restructurings were performing in accordance with their modified terms as of June 30, 2021 and June 30, 2020.
The Company did not have any loans with COVID loan modifications as of June 30, 2021.
Income Statement Review
Net Interest Income
Net interest income was $16.5 million for the three months ended June 30, 2021, an increase of $2.6 million or 18.9% from $13.9 million for the three months ended June 30, 2020. The net interest margin was 3.31% for the three months ended June 30, 2021 as compared to 3.27% for the three months ended June 30, 2020.
Average loans net of unearned income increased $134.5 million or 9.2% compared to the three months ended June 30, 2020, with a 32 basis point decline in yield. Average securities increased $118.3 million or 85.5% compared to the three months ended June 30, 2020, with a 79 basis point decline in yield. Average interest-bearing deposits in other banks increased $35.1 million or 34.2% compared to the three months ended June 30, 2020, with a 2 basis point decline in yield. The average yield on interest-earning assets decreased 51 basis points from 4.25% for the three months ended June 30, 2020 to 3.74% for the three months ended June 30, 2021, primarily due to the decline in rates since the end of the second quarter of 2020.
The average cost of interest-bearing liabilities declined 81 basis points or 56.6% from 1.43% for the three months ended June 30, 2020 to 0.62% for the three months ended June 30, 2021. The average cost of interest-bearing deposits decreased 81 basis points when comparing the quarter ended June 30, 2020 to the quarter ended June 30, 2021. The average cost of other borrowed funds decreased 60 basis points when comparing the quarter ended June 30, 2020 to the quarter ended June 30, 2021. The declines in funding costs were also primarily due to the decline in rates since the end of the second quarter of 2020.
Net interest margin, excluding PPP loans, was 3.32% for the three months ended June 30, 2021 and for the same period in 2020. The yield on interest-earning assets would have been 3.78% and the yield on loans would have been 4.47% for the three months ended June 30, 2021, if PPP loans were excluded. The increases in yields during the quarter are primarily related to higher fee income as a result of the elevated payoff activity within the commercial and construction and development loan portfolios.
Net interest income was $32.8 million for the six months ended June 30, 2021, an increase of $6.1 million or 22.7% from $26.7 million for the six months ended June 30, 2020. The net interest margin was 3.37% for the six months ended June 30, 2021 as compared to 3.30% for the six months ended June 30, 2020.
Average loans net of unearned income increased $195.0 million or 14.0% compared to the six months ended June 30, 2020, with a 39 basis point decline in yield. Average securities increased $81.4 million or 59.4% compared to the six months ended June 30, 2020, with a 76 basis point decline in yield. Average interest-bearing deposits in other banks increased $54.2 million or 55.2% compared to the six months ended June 30, 2020, with a 57 basis point decline in yield. The average yield on interest-earning assets decreased 58 basis points from 4.43% for the six months ended June 30, 2020 to 3.85% for the six months ended June 30, 2021, primarily due to the decline in rates since the end of the second quarter of 2020.
The average cost of interest-bearing liabilities declined 92 basis points or 57.5% from 1.60% for the six months ended June 30, 2020 to 0.68% for the six months ended June 30, 2021. The average cost of interest-bearing deposits decreased 92 basis points when comparing the six months ended June 30, 2020 to same period in 2021. The average cost of other borrowed funds decreased 68 basis points when comparing the six months ended June 30, 2020 to the same period in 2021. The declines in funding costs were also primarily due to the decline in rates since the end of the second quarter of 2020.
Net interest margin, excluding PPP loans, was 3.29% for the six months ended June 30, 2021. The yield on interest-earning assets would have been 3.79% and the yield on loans would have been 4.47% for the six months ended June 30, 2021, if PPP loans were excluded.
On a linked quarterly basis, net interest margin, excluding PPP loans, increased from 3.25% for the quarter ended March 31, 2021 to 3.32% for the quarter ended June 30, 2021. The average yield on interest-earning assets, excluding PPP loans, decreased 3 basis points from 3.81% for the three months ended March 31, 2021 to 3.78% for the three months ended June 30, 2021 and yield on loans remained consistent at 4.47%. The average cost of interest-bearing deposits decreased 12 basis points from 0.64% for the three months ended March 31, 2021 to 0.52% for the three months ended June 30, 2021. The average cost of other borrowed funds decreased 2 basis points from 0.69% for the three months ended March 31, 2021 to 0.67% for the three months ended June 30, 2021.
Provision for Loan Losses
The Company had a $90 thousand provision for loan losses for the three months ended June 30, 2021, compared to $1.5 million for the same period in 2020. The Company had $90 thousand in charge-offs during the second quarter of 2021 related to a loan that the Bank sold as part of a portfolio management strategy. There were no charge-offs during the second quarter of 2020.
The Company had a $2.5 million provision for loan losses for the six months ended June 30, 2021, compared to $1.9 million for the same period in 2020. The Company had $91 thousand in charge-offs during the six months ended 2021 and $42 thousand in net loan recoveries during the first six months of 2020.
The allowance for loan losses as a percentage of total loans increased from 0.84% at June 30, 2020 to 1.24% at June 30, 2021. The allowance for loan losses increased $6.7 million or 52.3% from June 30, 2020 to June 30, 2021. The allowance for loan losses as a percentage of total loans (excluding PPP loans) increased from 0.93% at June 30, 2020 to 1.30% at June 30, 2021. The Company does not have a reserve on PPP loan balances, as they are 100% guaranteed by the U.S. Small Business Administration.
The Company continues to monitor and evaluate additional information as it becomes available concerning COVID and a number of economic performance metrics, including those related to the overall economy as well as specific industry sectors. The Company believes the allowance for loan losses was adequate to absorb probable losses inherent in the loan portfolio as of June 30, 2021. The continued evolution of COVID and the intensity of its socioeconomic effects, which are inherently uncertain, may positively or negatively impact the level of the allowance and provision in future periods.
Noninterest Income
The Company’s recurring sources of noninterest income consist primarily of bank owned life insurance income, service charges on deposit accounts and insurance commissions. Generally speaking, loan fees are included in interest income on the loan portfolio and not reported as noninterest income.
For the three and six months ended June 30, 2021, the Company reported total noninterest income of $417 thousand and $881 thousand, respectively, compared to $638 thousand for the three months ended June 30, 2020 and $882 thousand for the six months ended June 30, 2020. The decrease in noninterest income during the reporting periods was primarily due to a decrease in gains on sales of securities. Excluding gains from the sale of securities, the Company experienced increases of $76 thousand and $298 thousand during the three and six months ended June 30, 2021, respectively, when compared to the same periods in 2020. These increases were primarily attributable to increases in insurance commissions as a result of higher production and related incentives, an increase in other income as a result of a loan commitment fee received for a loan that did not close, and increases due to service charges on deposits.
Noninterest Expense
For the three months ended June 30, 2021, noninterest expense increased 23.1% to $9.1 million relative to the same period in 2020. Salaries and employee benefits expense was $5.7 million during the three months ended June 30, 2021, up $1.2 million or 27.9% when compared to $4.4 million during the three months ended June 30, 2020. Occupancy expense increased 5.1% or $25 thousand and furniture and equipment expense decreased 32.1% or $179 thousand when comparing the three months ended June 30, 2021 to the same period in 2020. Other operating expense increased by 32.9% or $617 thousand when comparing the three months ended June 30, 2021 to the same period in 2020.
For the six months ended June 30, 2021, noninterest expense increased 16.9% to $17.0 million relative to the same period in 2020. For the six months ended June 30, 2021, salaries and employee benefits expense increased 19.5% or $1.7 million compared to the six months ended June 30, 2020. Occupancy expense increased 4.6% or $45 thousand and furniture and equipment decreased 24.4% or $226 thousand when comparing the six months ended June 30, 2021 to the same period in 2020. Other operating expense increased by 24.3% or $894 thousand, during the six months ended June 30, 2021, compared to the same period in 2020.
For both the three and six months ended June 30, 2021, the increase in salaries and employee benefits was primarily related to increases in headcount within the Bank and incentive compensation tied to performance. The headcount increases are investments in the Bank’s future growth. As in the past, management expects these staffing additions will lead to subsequent increases in revenues. Incentive compensation expense accruals can fluctuate significantly from quarter to quarter, based upon the Company’s financial performance and condition measured against, among other evaluation criteria, our strategic plan and budget. Increases in occupancy expense were primarily related to additional cleaning expenses related to COVID and general increase in rent expenses. Furniture and equipment expense declined due to renegotiation of software and equipment contracts during the past year. The increase in other operating expense for the three and six months ended June 30, 2021 when compared to the same periods in 2020 was primarily due to increases in legal expenses (including contemplated registration of the Company’s shares with the Securities and Exchange Commission), consulting expenses, marketing expenses, state bank franchise taxes, and expense associated with higher Federal Deposit Insurance Corporation deposit insurance that correlates directly to the Bank’s increase of insured deposit balances.
About John Marshall Bancorp, Inc.
John Marshall Bancorp, Inc. is the bank holding company for John Marshall Bank. John Marshall Bank is headquartered in Reston, Virginia with eight full-service branches located in Alexandria, Arlington, Loudoun, Prince William, Reston, Rockville, Tysons, and Washington, D.C. and one loan production office in Arlington, Virginia. The Company is dedicated to providing an exceptional customer experience and value to local businesses, business owners and consumers in the Washington D.C. Metro area. The Bank offers a comprehensive line of sophisticated banking products, services and a digital platform that rival those of the largest banks. Dedicated relationship managers serving as direct point-of-contact along with an experienced staff help achieve customer’s financial goals. Learn more at www.johnmarshallbank.com.
In addition to historical information, this press release contains certain forward-looking statements within the meaning of the Private Securities Litigation Reform Act of 1995 which are based on certain assumptions and describe future plans, strategies and expectations of the Company. These forward-looking statements are generally identified by use of the words “believe,” “expect,” “intend,” “anticipate,” “estimate,” “project,” “will,” “should,” “may,” “view,” “opportunity,” “potential,” or similar expressions or expressions of confidence. The Company’s ability to predict results or the actual effect of future plans or strategies is inherently uncertain. Factors which could have a material adverse effect on the operations of the Company and its subsidiary include, but are not limited to the following: changes in interest rates, general economic conditions, public health crises (such as the governmental, social and economic effects of COVID), levels of unemployment in the Bank’s lending area, real estate market values in the Bank’s lending area, future natural disasters, the level of prepayments on loans and mortgage-backed securities, legislative/regulatory changes, monetary and fiscal policies of the U.
Contacts
Chris Bergstrom
(703) 584-0840