Hilton Reports Fourth Quarter and Full Year Results
MCLEAN, Va.–(BUSINESS WIRE)–Hilton Worldwide Holdings Inc. (“Hilton” or the “Company”) (NYSE: HLT) today reported its fourth quarter and full year 2021 results. The following results reflect the material impact that the coronavirus (“COVID-19”) pandemic has had on Hilton’s business. Highlights include:

![]()
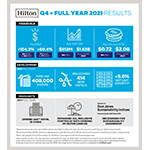
- Diluted EPS was $0.52 for the fourth quarter and $1.46 for the full year, and diluted EPS, adjusted for special items, was $0.72 for the fourth quarter and $2.08 for the full year
- Net income was $148 million for the fourth quarter and $407 million for the full year
- Adjusted EBITDA was $512 million for the fourth quarter and $1,629 million for the full year
- System-wide comparable RevPAR increased 104.2 percent and 60.4 percent, on a currency neutral basis, for the fourth quarter and full year, respectively, from the same periods in 2020
- System-wide comparable RevPAR was down 13.5 percent and 30.0 percent, on a currency neutral basis, for the fourth quarter and full year, respectively, compared to the same periods in 2019
- Approved 26,000 new rooms for development during the fourth quarter, bringing Hilton’s development pipeline to 408,000 rooms as of December 31, 2021
- Added 16,100 rooms to Hilton’s system in the fourth quarter, contributing to 55,100 net additional rooms in Hilton’s system for the full year, which represented 5.6 percent net unit growth from December 31, 2020
- Full year 2022 net unit growth is expected to be approximately 5 percent
Overview
Christopher J. Nassetta, President & Chief Executive Officer of Hilton, said, “We were pleased to see continued recovery throughout 2021, with our fourth quarter showing strong results versus 2019. Although new variants of the virus have had some short-term impact, we are optimistic about the acceleration of recovery across all segments during 2022. We remain confident in the future of our business and our ability to continue to drive strong net unit growth and free cash flow, fueled by higher margins.”
During the three months and year ended December 31, 2021, while the COVID-19 pandemic continued to negatively impact Hilton’s business and hotel operating statistics, Hilton experienced significant improvement in its results compared to 2020 attributable to increased travel and tourism. As a result of the pandemic, certain hotels suspended operations at various times throughout 2020, but the majority of those hotels were reopened by the beginning of 2021. In line with the recovery, although some hotels did suspend operations during the year ended December 31, 2021, reopenings significantly outpaced suspensions. As such, the operations of only approximately 360 hotels, primarily located in the U.S. and Europe, were suspended for some period of time during the year ended December 31, 2021, as compared to approximately 1,280 hotels during the year ended December 31, 2020. Nearly all of the hotels that suspended operations at some point since the start of the pandemic had reopened as of December 31, 2021.
For the three months and year ended December 31, 2021, system-wide comparable RevPAR increased 104.2 percent and 60.4 percent, respectively, compared to the same periods in 2020, due to increases in both occupancy and ADR. For the three months and year ended December 31, 2021, fee revenues increased 91 percent and 60 percent, respectively, compared to the same periods in 2020. For comparison to pre-pandemic results, system-wide comparable RevPAR for the three months and year ended December 31, 2021 were down 13.5 percent and 30.0 percent, respectively, compared to the three months and year ended December 31, 2019.
For the three months ended December 31, 2021, diluted EPS was $0.52 and diluted EPS, adjusted for special items, was $0.72 compared to $(0.81) and $(0.10), respectively, for the three months ended December 31, 2020. Net income (loss) and Adjusted EBITDA were $148 million and $512 million, respectively, for the three months ended December 31, 2021, compared to $(225) million and $204 million, respectively, for the three months ended December 31, 2020.
For the year ended December 31, 2021, diluted EPS was $1.46 and diluted EPS, adjusted for special items, was $2.08 compared to $(2.58) and $0.10, respectively, for the year ended December 31, 2020. Net income (loss) and Adjusted EBITDA were $407 million and $1,629 million, respectively, for the year ended December 31, 2021, compared to $(720) million and $842 million, respectively, for the year ended December 31, 2020.
Development
In the fourth quarter of 2021, Hilton opened 94 new hotels totaling 16,100 rooms and achieved net unit growth of 13,100 rooms. During the full year 2021, Hilton opened 414 new hotels totaling 67,100 rooms and achieved net unit growth of 55,100 rooms. During the quarter, Hilton continued the expansion of its luxury portfolio with the openings of the Conrad Tulum Riviera Maya in Mexico and the Conrad Jiuzhaigou in China and also opened the Hilton Cancun in Mexico, the latest addition to Hilton’s rapidly expanding portfolio of all-inclusive properties. Further, Hilton continues to see growth in its focused service brands, with Hampton by Hilton opening over 30 hotels representing 4,300 rooms during the fourth quarter.
As of December 31, 2021, Hilton’s development pipeline totaled nearly 2,670 hotels representing nearly 408,000 rooms throughout 115 countries and territories, including 28 countries and territories where Hilton does not currently have any existing hotels. Additionally, of the rooms in the development pipeline, 198,000 of the rooms were under construction and 249,600 of the rooms were located outside the U.S.
Balance Sheet and Liquidity
As of December 31, 2021, Hilton had $8.9 billion of long-term debt outstanding, excluding deferred financing costs and discount, with a weighted average interest rate of 3.99 percent. Excluding finance lease liabilities and other debt of Hilton’s consolidated variable interest entities, Hilton had $8.6 billion of long-term debt outstanding with a weighted average interest rate of 3.95 percent and no scheduled maturities until 2025. No amounts were outstanding under Hilton’s $1.75 billion senior secured revolving credit facility as of December 31, 2021, which had an available borrowing capacity of $1,690 million after considering $60 million of outstanding letters of credit. Total cash and cash equivalents were $1,512 million as of December 31, 2021, including $85 million of restricted cash and cash equivalents.
Conference Call
Hilton will host a conference call to discuss fourth quarter and full year 2021 results on February 16, 2022 at 10:00 a.m. Eastern Time. Participants may listen to the live webcast by logging on to the Hilton Investor Relations website at https://ir.hilton.com/events-and-presentations. A replay and transcript of the webcast will be available within 24 hours after the live event at https://ir.hilton.com/financial-reporting/quarterly-results/2021.
Alternatively, participants may listen to the live call by dialing 1-888-317-6003 in the United States (“U.S.”) or 1-412-317-6061 internationally using the conference ID 6060716. Participants are encouraged to dial into the call or link to the webcast at least fifteen minutes prior to the scheduled start time. A telephone replay will be available for seven days following the call. To access the telephone replay, dial 1-877-344-7529 in the U.S. or 1-412-317-0088 internationally using the conference ID 8884149.
Forward-Looking Statements
This press release contains forward-looking statements within the meaning of Section 27A of the Securities Act of 1933, as amended, and Section 21E of the Securities Exchange Act of 1934, as amended. These statements include, but are not limited to, statements related to the expectations regarding the impact of and recovery from the COVID-19 pandemic, the performance of Hilton’s business, financial results, liquidity and capital resources and other non-historical statements. In some cases, these forward-looking statements can be identified by the use of words such as “outlook,” “believes,” “expects,” “potential,” “continues,” “may,” “will,” “should,” “could,” “seeks,” “projects,” “predicts,” “intends,” “plans,” “estimates,” “anticipates” or the negative version of these words or other comparable words. Such forward-looking statements are subject to various risks and uncertainties including, among others, risks inherent to the hospitality industry, macroeconomic factors beyond Hilton’s control, such as challenges due to labor shortages and supply chain disruptions, risks related to the impact of the COVID-19 pandemic, including as a result of new strains or variants of the virus and uncertainty of acceptance of the COVID-19 vaccines and their effectiveness, competition for hotel guests and management and franchise contracts, risks related to doing business with third-party hotel owners, performance of Hilton’s information technology systems, growth of reservation channels outside of Hilton’s system, risks of doing business outside of the U.S. and Hilton’s indebtedness. Additional factors that could cause Hilton’s results to differ materially from those described in the forward-looking statements can be found under the section entitled “Part I—Item 1A. Risk Factors” of Hilton’s Annual Report on Form 10-K for the fiscal year ended December 31, 2020, filed with the Securities and Exchange Commission (the “SEC”), as such factors may be updated from time to time in Hilton’s periodic filings with the SEC, including Hilton’s Annual Report on Form 10-K for the fiscal year ended December 31, 2021, which is expected to be filed on or about the date of this press release, which are accessible on the SEC’s website at www.sec.gov. Accordingly, there are or will be important factors that could cause actual outcomes or results to differ materially from those indicated in these statements. These factors should not be construed as exhaustive and should be read in conjunction with the other cautionary statements that are included in this press release and in Hilton’s filings with the SEC. The Company undertakes no obligation to publicly update or review any forward-looking statement, whether as a result of new information, future developments or otherwise, except as required by law.
Definitions
See the “Definitions” section for the definition of certain terms used within this press release, including within the schedules.
Non-GAAP Financial Measures
The Company refers to certain financial measures that are not recognized under U.S. generally accepted accounting principles (“GAAP”) in this press release, including: net income (loss), adjusted for special items; diluted EPS, adjusted for special items; EBITDA; Adjusted EBITDA; Adjusted EBITDA margin; net debt; and net debt to Adjusted EBITDA ratio. See the schedules to this press release, including the “Definitions” section, for additional information and reconciliations of such non-GAAP financial measures.
About Hilton
Hilton (NYSE: HLT) is a leading global hospitality company with a portfolio of 18 world-class brands comprising more than 6,800 properties and more than 1 million rooms in 122 countries and territories. Dedicated to fulfilling its founding vision to fill the earth with the light and warmth of hospitality, Hilton has welcomed more than 3 billion guests in its more than 100-year history, earned a top spot on the 2021 World’s Best Workplaces list and been recognized as a global leader on the Dow Jones Sustainability Indices for five consecutive years. In 2021, in addition to opening more than one hotel a day, Hilton introduced several industry-leading technology enhancements to improve the guest experience, including Digital Key Share, automated complimentary room upgrades and the ability to book confirmed connecting rooms. Through the award-winning guest loyalty program Hilton Honors, the nearly 128 million members who book directly with Hilton can earn Points for hotel stays and experiences money can’t buy. With the free Hilton Honors app, guests can book their stay, select their room, check in, unlock their door with a Digital Key and check out, all from their smartphone. Visit newsroom.hilton.com for more information, and connect with Hilton on facebook.com/hiltonnewsroom, twitter.com/hiltonnewsroom, linkedin.com/company/hilton, instagram.com/hiltonnewsroom and youtube.com/hiltonnewsroom.
| HILTON WORLDWIDE HOLDINGS INC. |
| EARNINGS RELEASE SCHEDULES |
| TABLE OF CONTENTS |
|
|
| Consolidated Statements of Operations |
| Comparable and Currency Neutral System-Wide Hotel Operating Statistics |
| Property Summary |
| Capital Expenditures and Contract Acquisition Costs |
| Reconciliations of Non-GAAP Financial Measures |
| Definitions |
| HILTON WORLDWIDE HOLDINGS INC. | ||||||||||||||||
| CONSOLIDATED STATEMENTS OF OPERATIONS | ||||||||||||||||
| (unaudited, in millions, except share and per share data) | ||||||||||||||||
|
| Three Months Ended |
| Year Ended | |||||||||||||
|
| 2021 |
| 2020 |
| 2021 |
| 2020 | |||||||||
| Revenues |
|
|
|
|
|
|
| |||||||||
| Franchise and licensing fees | $ | 431 |
|
| $ | 233 |
|
| $ | 1,493 |
|
| $ | 945 |
| |
| Base and other management fees |
| 60 |
|
|
| 31 |
|
|
| 176 |
|
|
| 123 |
| |
| Incentive management fees |
| 38 |
|
|
| 13 |
|
|
| 98 |
|
|
| 38 |
| |
| Owned and leased hotels |
| 222 |
|
|
| 86 |
|
|
| 598 |
|
|
| 421 |
| |
| Other revenues |
| 23 |
|
|
| 21 |
|
|
| 79 |
|
|
| 73 |
| |
|
|
| 774 |
|
|
| 384 |
|
|
| 2,444 |
|
|
| 1,600 |
| |
| Other revenues from managed and franchised properties |
| 1,062 |
|
|
| 506 |
|
|
| 3,344 |
|
|
| 2,707 |
| |
| Total revenues |
| 1,836 |
|
|
| 890 |
|
|
| 5,788 |
|
|
| 4,307 |
| |
|
|
|
|
|
|
|
|
| |||||||||
| Expenses |
|
|
|
|
|
|
| |||||||||
| Owned and leased hotels |
| 227 |
|
|
| 142 |
|
|
| 679 |
|
|
| 620 |
| |
| Depreciation and amortization |
| 45 |
|
|
| 62 |
|
|
| 188 |
|
|
| 331 |
| |
| General and administrative |
| 103 |
|
|
| 122 |
|
|
| 405 |
|
|
| 311 |
| |
| Reorganization costs |
| — |
|
|
| 3 |
|
|
| — |
|
|
| 41 |
| |
| Impairment losses |
| — |
|
|
| 122 |
|
|
| — |
|
|
| 258 |
| |
| Other expenses |
| 14 |
|
|
| 12 |
|
|
| 45 |
|
|
| 60 |
| |
|
|
| 389 |
|
|
| 463 |
|
|
| 1,317 |
|
|
| 1,621 |
| |
| Other expenses from managed and franchised properties |
| 1,115 |
|
|
| 622 |
|
|
| 3,454 |
|
|
| 3,104 |
| |
| Total expenses |
| 1,504 |
|
|
| 1,085 |
|
|
| 4,771 |
|
|
| 4,725 |
| |
|
|
|
|
|
|
|
|
| |||||||||
| Gain (loss) on sales of assets, net |
| 1 |
|
|
| — |
|
|
| (7 | ) |
|
| — |
| |
|
|
|
|
|
|
|
|
| |||||||||
| Operating income (loss) |
| 333 |
|
|
| (195 | ) |
|
| 1,010 |
|
|
| (418 | ) | |
|
|
|
|
|
|
|
|
| |||||||||
| Interest expense |
| (95 | ) |
|
| (113 | ) |
|
| (397 | ) |
|
| (429 | ) | |
| Loss on foreign currency transactions |
| (8 | ) |
|
| (11 | ) |
|
| (7 | ) |
|
| (27 | ) | |
| Loss on debt extinguishments |
| — |
|
|
| (48 | ) |
|
| (69 | ) |
|
| (48 | ) | |
| Other non-operating income (loss), net |
| 7 |
|
|
| 18 |
|
|
| 23 |
|
|
| (2 | ) | |
|
|
|
|
|
|
|
|
| |||||||||
| Income (loss) before income taxes |
| 237 |
|
|
| (349 | ) |
|
| 560 |
|
|
| (924 | ) | |
|
|
|
|
|
|
|
|
| |||||||||
| Income tax benefit (expense) |
| (89 | ) |
|
| 124 |
|
|
| (153 | ) |
|
| 204 |
| |
|
|
|
|
|
|
|
|
| |||||||||
| Net income (loss) |
| 148 |
|
|
| (225 | ) |
|
| 407 |
|
|
| (720 | ) | |
| Net loss (income) attributable to noncontrolling interests |
| (1 | ) |
|
| 1 |
|
|
| 3 |
|
|
| 5 |
| |
| Net income (loss) attributable to Hilton stockholders | $ | 147 |
|
| $ | (224 | ) |
| $ | 410 |
|
| $ | (715 | ) | |
|
|
|
|
|
|
|
|
| |||||||||
| Weighted average shares outstanding: |
|
|
|
|
|
|
| |||||||||
| Basic |
| 279 |
|
|
| 278 |
|
|
| 279 |
|
|
| 277 |
| |
| Diluted(1) |
| 282 |
|
|
| 278 |
|
|
| 281 |
|
|
| 277 |
| |
|
|
|
|
|
|
|
|
| |||||||||
| Earnings (loss) per share: |
|
|
|
|
|
|
| |||||||||
| Basic | $ | 0.53 |
|
| $ | (0.81 | ) |
| $ | 1.47 |
|
| $ | (2.58 | ) | |
| Diluted(1) | $ | 0.52 |
|
| $ | (0.81 | ) |
| $ | 1.46 |
|
| $ | (2.58 | ) | |
|
|
|
|
|
|
|
|
| |||||||||
| Cash dividends declared per share | $ | — |
|
| $ | — |
|
| $ | — |
|
| $ | 0.15 |
| |
| ____________ | ||
| (1) | The weighted average shares outstanding used in the calculation of diluted loss per share for the three months and year ended December 31, 2020 were revised from the previously reported amounts. Refer to “Reconciliations of Non-GAAP Financial Measures – Net Income (Loss) and Diluted EPS, Adjusted for Special Items” for additional information. | |
| HILTON WORLDWIDE HOLDINGS INC. | ||||||||||||||||||
| COMPARABLE AND CURRENCY NEUTRAL SYSTEM-WIDE HOTEL OPERATING STATISTICS | ||||||||||||||||||
| BY REGION | ||||||||||||||||||
| (unaudited) | ||||||||||||||||||
|
| Three Months Ended December 31, | |||||||||||||||||
|
| Occupancy |
| ADR |
| RevPAR | |||||||||||||
|
| 2021 |
| vs. 2020 |
| 2021 |
| vs. 2020 |
| 2021 |
| vs. 2020 | |||||||
| U.S. | 63.3 | % |
| 21.8 | % pts. |
| $ | 141.29 |
| 37.4 | % |
| $ | 89.38 |
| 109.7 | % | |
| Americas (excluding U.S.) | 53.8 |
|
| 26.7 |
|
|
| 118.53 |
| 26.1 |
|
|
| 63.81 |
| 149.9 |
| |
| Europe | 56.8 |
|
| 34.1 |
|
|
| 134.48 |
| 62.4 |
|
|
| 76.35 |
| 305.8 |
| |
| Middle East & Africa | 67.1 |
|
| 28.2 |
|
|
| 164.73 |
| 29.5 |
|
|
| 110.48 |
| 123.5 |
| |
| Asia Pacific | 52.5 |
|
| (4.3 | ) |
|
| 104.16 |
| 6.7 |
|
|
| 54.73 |
| (1.4 | ) | |
| System-wide | 61.3 |
|
| 20.7 |
|
|
| 137.29 |
| 35.2 |
|
|
| 84.14 |
| 104.2 |
| |
|
| Year Ended December 31, | |||||||||||||||||
|
| Occupancy |
| ADR |
| RevPAR | |||||||||||||
|
| 2021 |
| vs. 2020 |
| 2021 |
| vs. 2020 |
| 2021 |
| vs. 2020 | |||||||
| U.S. | 60.8 | % |
| 18.8 | % pts. |
| $ | 132.94 |
| 13.8 | % |
| $ | 80.88 |
| 64.5 | % | |
| Americas (excluding U.S.) | 44.0 |
|
| 15.8 |
|
|
| 111.68 |
| 3.7 |
|
|
| 49.17 |
| 61.7 |
| |
| Europe | 41.9 |
|
| 13.6 |
|
|
| 121.84 |
| 12.6 |
|
|
| 51.10 |
| 66.7 |
| |
| Middle East & Africa | 52.6 |
|
| 18.1 |
|
|
| 139.02 |
| 10.0 |
|
|
| 73.08 |
| 67.7 |
| |
| Asia Pacific | 50.5 |
|
| 6.0 |
|
|
| 101.08 |
| 4.0 |
|
|
| 51.06 |
| 18.1 |
| |
| System-wide | 57.2 |
|
| 16.9 |
|
|
| 128.82 |
| 12.9 |
|
|
| 73.65 |
| 60.4 |
| |
| HILTON WORLDWIDE HOLDINGS INC. | ||||||||||||||||||
| COMPARABLE AND CURRENCY NEUTRAL SYSTEM-WIDE HOTEL OPERATING STATISTICS | ||||||||||||||||||
| BY BRAND | ||||||||||||||||||
| (unaudited) | ||||||||||||||||||
|
| Three Months Ended December 31, | |||||||||||||||||
|
| Occupancy |
| ADR |
| RevPAR | |||||||||||||
|
| 2021 |
| vs. 2020 |
| 2021 |
| vs. 2020 |
| 2021 |
| vs. 2020 | |||||||
| Waldorf Astoria Hotels & Resorts | 55.1 | % |
| 23.9 | % pts. |
| $ | 596.43 |
| 42.2 | % |
| $ | 328.51 |
| 151.2 | % | |
| Conrad Hotels & Resorts | 55.5 |
|
| 19.2 |
|
|
| 238.27 |
| 27.9 |
|
|
| 132.32 |
| 95.7 |
| |
| Canopy by Hilton | 59.0 |
|
| 30.3 |
|
|
| 155.67 |
| 28.8 |
|
|
| 91.83 |
| 165.1 |
| |
| Hilton Hotels & Resorts | 53.3 |
|
| 23.6 |
|
|
| 161.82 |
| 33.1 |
|
|
| 86.22 |
| 139.0 |
| |
| Curio Collection by Hilton | 59.1 |
|
| 26.1 |
|
|
| 212.69 |
| 37.1 |
|
|
| 125.62 |
| 145.3 |
| |
| DoubleTree by Hilton | 55.8 |
|
| 21.1 |
|
|
| 124.55 |
| 36.3 |
|
|
| 69.55 |
| 118.8 |
| |
| Tapestry Collection by Hilton | 59.7 |
|
| 26.9 |
|
|
| 151.38 |
| 32.9 |
|
|
| 90.32 |
| 141.9 |
| |
| Embassy Suites by Hilton | 61.5 |
|
| 25.9 |
|
|
| 155.14 |
| 37.3 |
|
|
| 95.45 |
| 137.2 |
| |
| Hilton Garden Inn | 61.8 |
|
| 21.8 |
|
|
| 124.40 |
| 38.6 |
|
|
| 76.92 |
| 114.3 |
| |
| Hampton by Hilton | 64.8 |
|
| 17.8 |
|
|
| 118.35 |
| 31.3 |
|
|
| 76.69 |
| 81.2 |
| |
| Tru by Hilton | 65.3 |
|
| 19.1 |
|
|
| 111.64 |
| 34.0 |
|
|
| 72.92 |
| 89.2 |
| |
| Homewood Suites by Hilton | 74.3 |
|
| 16.5 |
|
|
| 133.66 |
| 27.1 |
|
|
| 99.33 |
| 63.5 |
| |
| Home2 Suites by Hilton | 74.3 |
|
| 16.9 |
|
|
| 119.32 |
| 25.9 |
|
|
| 88.67 |
| 63.0 |
| |
| System-wide | 61.3 |
|
| 20.7 |
|
|
| 137.29 |
| 35.2 |
|
|
| 84.14 |
| 104.2 |
| |
|
| Year Ended December 31, | |||||||||||||||||
|
| Occupancy |
| ADR |
| RevPAR | |||||||||||||
|
| 2021 |
| vs. 2020 |
| 2021 |
| vs. 2020 |
| 2021 |
| vs. 2020 | |||||||
| Waldorf Astoria Hotels & Resorts | 45.5 | % |
| 13.0 | % pts. |
| $ | 556.40 |
| 45.7 | % |
| $ | 252.99 |
| 104.1 | % | |
| Conrad Hotels & Resorts | 43.4 |
|
| 11.3 |
|
|
| 215.81 |
| 9.1 |
|
|
| 93.66 |
| 47.4 |
| |
| Canopy by Hilton | 48.0 |
|
| 19.3 |
|
|
| 150.78 |
| 10.2 |
|
|
| 72.32 |
| 84.4 |
| |
| Hilton Hotels & Resorts | 44.8 |
|
| 13.6 |
|
|
| 152.24 |
| 7.9 |
|
|
| 68.19 |
| 54.9 |
| |
| Curio Collection by Hilton | 49.8 |
|
| 17.9 |
|
|
| 199.00 |
| 18.7 |
|
|
| 99.04 |
| 85.6 |
| |
| DoubleTree by Hilton | 50.4 |
|
| 15.5 |
|
|
| 117.82 |
| 10.3 |
|
|
| 59.35 |
| 59.3 |
| |
| Tapestry Collection by Hilton | 53.6 |
|
| 19.8 |
|
|
| 141.98 |
| 17.2 |
|
|
| 76.07 |
| 86.0 |
| |
| Embassy Suites by Hilton | 56.7 |
|
| 19.7 |
|
|
| 146.67 |
| 10.9 |
|
|
| 83.12 |
| 70.0 |
| |
| Hilton Garden Inn | 58.7 |
|
| 18.7 |
|
|
| 117.53 |
| 13.7 |
|
|
| 68.94 |
| 66.9 |
| |
| Hampton by Hilton | 63.3 |
|
| 18.0 |
|
|
| 114.14 |
| 15.2 |
|
|
| 72.23 |
| 61.2 |
| |
| Tru by Hilton | 65.6 |
|
| 21.6 |
|
|
| 107.40 |
| 21.7 |
|
|
| 70.51 |
| 81.5 |
| |
| Homewood Suites by Hilton | 73.9 |
|
| 17.5 |
|
|
| 125.57 |
| 9.7 |
|
|
| 92.82 |
| 43.7 |
| |
| Home2 Suites by Hilton | 74.6 |
|
| 19.6 |
|
|
| 114.14 |
| 13.3 |
|
|
| 85.20 |
| 53.6 |
| |
| System-wide | 57.2 |
|
| 16.9 |
|
|
| 128.82 |
| 12.9 |
|
|
| 73.65 |
| 60.4 |
| |
| HILTON WORLDWIDE HOLDINGS INC. | ||||||||||||||||||
| COMPARABLE AND CURRENCY NEUTRAL SYSTEM-WIDE HOTEL OPERATING STATISTICS | ||||||||||||||||||
| BY SEGMENT | ||||||||||||||||||
| (unaudited) | ||||||||||||||||||
|
| Three Months Ended December 31, | |||||||||||||||||
|
| Occupancy |
| ADR |
| RevPAR | |||||||||||||
|
| 2021 |
| vs. 2020 |
| 2021 |
| vs. 2020 |
| 2021 |
| vs. 2020 | |||||||
| Management and franchise | 61.5 | % |
| 20.6 | % pts. |
| $ | 136.67 |
| 35.3 | % |
| $ | 84.04 |
| 103.5 | % | |
| Ownership(1) | 47.7 |
|
| 26.5 |
|
|
| 189.34 |
| 14.7 |
|
|
| 90.27 |
| 158.0 |
| |
| System-wide | 61.3 |
|
| 20.7 |
|
|
| 137.29 |
| 35.2 |
|
|
| 84.14 |
| 104.2 |
| |
|
| Year Ended December 31, | |||||||||||||||||
|
| Occupancy |
| ADR |
| RevPAR | |||||||||||||
|
| 2021 |
| vs. 2020 |
| 2021 |
| vs. 2020 |
| 2021 |
| vs. 2020 | |||||||
| Management and franchise | 57.5 | % |
| 17.1 | % pts. |
| $ | 128.44 |
| 13.1 | % |
| $ | 73.91 |
| 60.8 | % | |
| Ownership(1) | 33.2 |
|
| 7.9 |
|
|
| 172.10 |
| 1.5 |
|
|
| 57.22 |
| 33.4 |
| |
| System-wide | 57.2 |
|
| 16.9 |
|
|
| 128.82 |
| 12.9 |
|
|
| 73.65 |
| 60.4 |
| |
| ____________ | ||
| (1) | Includes hotels leased by entities in which Hilton owns a noncontrolling financial interest. | |
| HILTON WORLDWIDE HOLDINGS INC. | ||||||||||||||||
| PROPERTY SUMMARY | ||||||||||||||||
| As of December 31, 2021 | ||||||||||||||||
|
| Owned / Leased(1) |
| Managed |
| Franchised |
| Total | |||||||||
|
| Properties |
| Rooms |
| Properties |
| Rooms |
| Properties |
| Rooms |
| Properties |
| Rooms | |
| Waldorf Astoria Hotels & Resorts |
|
|
|
|
|
|
|
|
|
|
|
|
|
|
| |
| U.S. | — |
| — |
| 12 |
| 4,535 |
| — |
| — |
| 12 |
| 4,535 | |
| Americas (excluding U.S.) | — |
| — |
| 2 |
| 261 |
| — |
| — |
| 2 |
| 261 | |
| Europe | 2 |
| 463 |
| 4 |
| 898 |
| — |
| — |
| 6 |
| 1,361 | |
| Middle East & Africa | — |
| — |
| 5 |
| 1,224 |
| — |
| — |
| 5 |
| 1,224 | |
| Asia Pacific | — |
| — |
| 6 |
| 1,259 |
| — |
| — |
| 6 |
| 1,259 | |
| LXR Hotels & Resorts |
|
|
|
|
|
|
|
|
|
|
|
|
|
|
| |
| U.S. | — |
| — |
| — |
| — |
| 3 |
| 426 |
| 3 |
| 426 | |
| Americas (excluding U.S.) | — |
| — |
| — |
| — |
| 1 |
| 76 |
| 1 |
| 76 | |
| Europe | — |
| — |
| 2 |
| 383 |
| — |
| — |
| 2 |
| 383 | |
| Middle East & Africa | — |
| — |
| 1 |
| 41 |
| 1 |
| 234 |
| 2 |
| 275 | |
| Asia Pacific | — |
| — |
| — |
| — |
| 1 |
| 114 |
| 1 |
| 114 | |
| Conrad Hotels & Resorts |
|
|
|
|
|
|
|
|
|
|
|
|
|
|
| |
| U.S. | — |
| — |
| 6 |
| 2,211 |
| 1 |
| 1,496 |
| 7 |
| 3,707 | |
| Americas (excluding U.S.) | — |
| — |
| 3 |
| 787 |
| — |
| — |
| 3 |
| 787 | |
| Europe | — |
| — |
| 4 |
| 1,155 |
| — |
| — |
| 4 |
| 1,155 | |
| Middle East & Africa | 1 |
| 614 |
| 3 |
| 1,569 |
| — |
| — |
| 4 |
| 2,183 | |
| Asia Pacific | 1 |
| 164 |
| 22 |
| 6,430 |
| 1 |
| 659 |
| 24 |
| 7,253 | |
| Canopy by Hilton |
|
|
|
|
|
|
|
|
|
|
|
|
|
|
| |
| U.S. | — |
| — |
| — |
| — |
| 23 |
| 3,908 |
| 23 |
| 3,908 | |
| Americas (excluding U.S.) | — |
| — |
| 2 |
| 272 |
| — |
| — |
| 2 |
| 272 | |
| Europe | — |
| — |
| 1 |
| 123 |
| 4 |
| 917 |
| 5 |
| 1,040 | |
| Middle East & Africa | — |
| — |
| 1 |
| 200 |
| — |
| — |
| 1 |
| 200 | |
| Asia Pacific | — |
| — |
| 4 |
| 614 |
| — |
| — |
| 4 |
| 614 | |
| Signia by Hilton |
|
|
|
|
|
|
|
|
|
|
|
|
|
|
| |
| U.S. | — |
| — |
| 1 |
| 1,009 |
| — |
| — |
| 1 |
| 1,009 | |
| Hilton Hotels & Resorts |
|
|
|
|
|
|
|
|
|
|
|
|
|
|
| |
| U.S. | — |
| — |
| 59 |
| 44,137 |
| 187 |
| 59,017 |
| 246 |
| 103,154 | |
| Americas (excluding U.S.) | 1 |
| 405 |
| 28 |
| 10,682 |
| 26 |
| 7,826 |
| 55 |
| 18,913 | |
| Europe | 39 |
| 11,514 |
| 45 |
| 15,388 |
| 43 |
| 11,268 |
| 127 |
| 38,170 | |
| Middle East & Africa | 5 |
| 1,992 |
| 37 |
| 12,659 |
| 3 |
| 1,565 |
| 45 |
| 16,216 | |
| Asia Pacific | 5 |
| 2,999 |
| 113 |
| 39,481 |
| 7 |
| 2,849 |
| 125 |
| 45,329 | |
| Curio Collection by Hilton |
|
|
|
|
|
|
|
|
|
|
|
|
|
|
| |
| U.S. | — |
| — |
| 7 |
| 3,272 |
| 59 |
| 12,578 |
| 66 |
| 15,850 | |
| Americas (excluding U.S.) | — |
| — |
| 2 |
| 99 |
| 12 |
| 1,750 |
| 14 |
| 1,849 | |
| Europe | — |
| — |
| 4 |
| 360 |
| 20 |
| 2,827 |
| 24 |
| 3,187 | |
| Middle East & Africa | — |
| — |
| 4 |
| 741 |
| 2 |
| 557 |
| 6 |
| 1,298 | |
| Asia Pacific | — |
| — |
| 4 |
| 773 |
| 2 |
| 248 |
| 6 |
| 1,021 | |
| DoubleTree by Hilton |
|
|
|
|
|
|
|
|
|
|
|
|
|
|
| |
| U.S. | — |
| — |
| 34 |
| 11,450 |
| 339 |
| 76,905 |
| 373 |
| 88,355 | |
| Americas (excluding U.S.) | — |
| — |
| 3 |
| 587 |
| 34 |
| 6,745 |
| 37 |
| 7,332 | |
| Europe | — |
| — |
| 14 |
| 3,741 |
| 108 |
| 18,286 |
| 122 |
| 22,027 | |
| Middle East & Africa | — |
| — |
| 17 |
| 4,599 |
| 5 |
| 568 |
| 22 |
| 5,167 | |
| Asia Pacific | — |
| — |
| 76 |
| 20,625 |
| 5 |
| 1,395 |
| 81 |
| 22,020 | |
| HILTON WORLDWIDE HOLDINGS INC. | ||||||||||||||||
| PROPERTY SUMMARY (continued) | ||||||||||||||||
| As of December 31, 2021 | ||||||||||||||||
|
| Owned / Leased(1) |
| Managed |
| Franchised |
| Total | |||||||||
|
| Properties |
| Rooms |
| Properties |
| Rooms |
| Properties |
| Rooms |
| Properties |
| Rooms | |
| Tapestry Collection by Hilton |
|
|
|
|
|
|
|
|
|
|
|
|
|
|
| |
| U.S. | — |
| — |
| — |
| — |
| 63 |
| 7,543 |
| 63 |
| 7,543 | |
| Americas (excluding U.S.) | — |
| — |
| 1 |
| 138 |
| 4 |
| 354 |
| 5 |
| 492 | |
| Europe | — |
| — |
| — |
| — |
| 3 |
| 162 |
| 3 |
| 162 | |
| Asia Pacific | — |
| — |
| 1 |
| 266 |
| 1 |
| 175 |
| 2 |
| 441 | |
| Embassy Suites by Hilton |
|
|
|
|
|
|
|
|
|
|
|
|
|
|
| |
| U.S. | — |
| — |
| 40 |
| 10,585 |
| 210 |
| 47,063 |
| 250 |
| 57,648 | |
| Americas (excluding U.S.) | — |
| — |
| 3 |
| 667 |
| 5 |
| 1,336 |
| 8 |
| 2,003 | |
| Motto by Hilton |
|
|
|
|
|
|
|
|
|
|
|
|
|
|
| |
| U.S. | — |
| — |
| — |
| — |
| 3 |
| 871 |
| 3 |
| 871 | |
| Hilton Garden Inn |
|
|
|
|
|
|
|
|
|
|
|
|
|
|
| |
| U.S. | — |
| — |
| 4 |
| 425 |
| 728 |
| 100,542 |
| 732 |
| 100,967 | |
| Americas (excluding U.S.) | — |
| — |
| 11 |
| 1,571 |
| 51 |
| 7,664 |
| 62 |
| 9,235 | |
| Europe | — |
| — |
| 19 |
| 3,642 |
| 60 |
| 9,727 |
| 79 |
| 13,369 | |
| Middle East & Africa | — |
| — |
| 16 |
| 3,400 |
| 3 |
| 474 |
| 19 |
| 3,874 | |
| Asia Pacific | — |
| — |
| 47 |
| 10,245 |
| 1 |
| 177 |
| 48 |
| 10,422 | |
| Hampton by Hilton |
|
|
|
|
|
|
|
|
|
|
|
|
|
|
| |
| U.S. | — |
| — |
| 27 |
| 3,519 |
| 2,281 |
| 224,999 |
| 2,308 |
| 228,518 | |
| Americas (excluding U.S.) | — |
| — |
| 13 |
| 1,644 |
| 109 |
| 13,305 |
| 122 |
| 14,949 | |
| Europe | — |
| — |
| 16 |
| 2,697 |
| 96 |
| 14,795 |
| 112 |
| 17,492 | |
| Middle East & Africa | — |
| — |
| 4 |
| 1,238 |
| — |
| — |
| 4 |
| 1,238 | |
| Asia Pacific | — |
| — |
| — |
| — |
| 219 |
| 35,633 |
| 219 |
| 35,633 | |
| Tru by Hilton |
|
|
|
|
|
|
|
|
|
|
|
|
|
|
| |
| U.S. | — |
| — |
| — |
| — |
| 212 |
| 20,664 |
| 212 |
| 20,664 | |
| Americas (excluding U.S.) | — |
| — |
| — |
| — |
| 2 |
| 179 |
| 2 |
| 179 | |
| Homewood Suites by Hilton |
|
|
|
|
|
|
|
|
|
|
|
|
|
|
| |
| U.S. | — |
| — |
| 10 |
| 1,172 |
| 489 |
| 55,819 |
| 499 |
| 56,991 | |
| Americas (excluding U.S.) | — |
| — |
| 3 |
| 406 |
| 24 |
| 2,688 |
| 27 |
| 3,094 | |
| Home2 Suites by Hilton |
|
|
|
|
|
|
|
|
|
|
|
|
|
|
| |
| U.S. | — |
| — |
| 2 |
| 210 |
| 512 |
| 53,596 |
| 514 |
| 53,806 | |
| Americas (excluding U.S.) | — |
| — |
| — |
| — |
| 7 |
| 753 |
| 7 |
| 753 | |
| Asia Pacific | — |
| — |
| — |
| — |
| 2 |
| 275 |
| 2 |
| 275 | |
| Other | — |
| — |
| 2 |
| 1,250 |
| 6 |
| 1,614 |
| 8 |
| 2,864 | |
| Total hotels | 54 |
| 18,151 |
| 745 |
| 234,640 |
| 5,978 |
| 812,622 |
| 6,777 |
| 1,065,413 | |
| Hilton Grand Vacations | — |
| — |
| — |
| — |
| 60 |
| 9,378 |
| 60 |
| 9,378 | |
| Total system | 54 |
| 18,151 |
| 745 |
| 234,640 |
| 6,038 |
| 822,000 |
| 6,837 |
| 1,074,791 | |
| ____________ | ||
| (1) | Includes hotels owned or leased by entities in which Hilton owns a noncontrolling financial interest. | |
| HILTON WORLDWIDE HOLDINGS INC. | ||||||||||||||
| CAPITAL EXPENDITURES AND CONTRACT ACQUISITION COSTS | ||||||||||||||
| (unaudited, dollars in millions) | ||||||||||||||
|
| ||||||||||||||
|
|
| Three Months Ended |
| Increase / (Decrease) | ||||||||||
|
|
| 2021 |
| 2020 |
| $ |
| % | ||||||
| Capital expenditures for property and equipment(1) |
| $ | 18 |
| $ | 8 |
| 10 |
|
| NM(3) | |||
| Capitalized software costs(2) |
|
| 16 |
|
|
| 8 |
|
| 8 |
|
| 100.0 |
|
| Total capital expenditures |
|
| 34 |
|
|
| 16 |
|
| 18 |
|
| NM(3) | |
| Contract acquisition costs |
|
| 40 |
|
|
| 13 |
|
| 27 |
|
| NM(3) | |
| Total capital expenditures and contract acquisition costs |
| $ | 74 |
|
| $ | 29 |
|
| 45 |
|
| NM(3) | |
|
| ||||||||||||||
|
|
| Year Ended |
| Increase / (Decrease) | ||||||||||
|
|
| 2021 |
| 2020 |
| $ |
| % | ||||||
| Capital expenditures for property and equipment(1) |
| $ | 35 |
|
| $ | 46 |
|
| (11 | ) |
| (23.9 | ) |
| Capitalized software costs(2) |
|
| 44 |
|
|
| 46 |
|
| (2 | ) |
| (4.3 | ) |
| Total capital expenditures |
|
| 79 |
|
|
| 92 |
|
| (13 | ) |
| (14.1 | ) |
| Contract acquisition costs |
|
| 200 |
|
|
| 50 |
|
| 150 |
|
| NM(3) | |
| Total capital expenditures and contract acquisition costs |
| $ | 279 |
|
| $ | 142 |
|
| 137 |
|
| 96.5 |
|
Contacts
Investor Contact
Jill Slattery
+1 703 883 5476
Media Contact
Megan Ryan
+1 703 883 6711