Annual Survey of Industries (ASI) Results for 2022-23

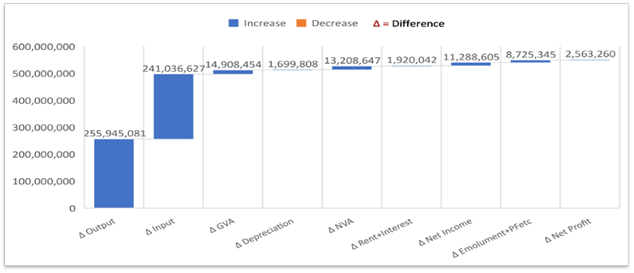
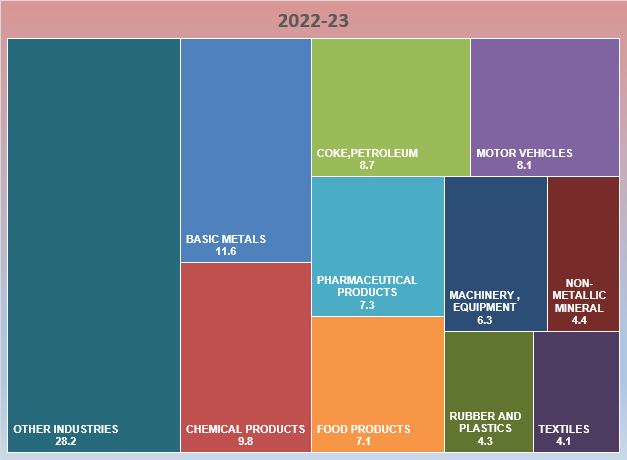
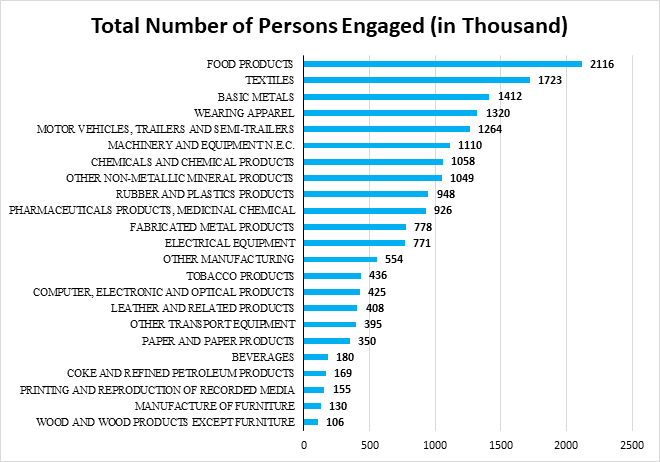
Introduction Ministry of Statistics and Programme Implementation (MoSPI) has released the results of Annual Survey of Industries (ASI) for the reference periods April 2022 to March 2023 (i.e. financial year 2022-23) referred to as ASI 2022-23 in this press note. The field work for this survey was carried out during November 2023 to June 2024 for ASI 2022-23. A brief note about the survey ASI 2022-23 is given at the Endnote. Annual Survey of Industries is conducted with the primary objective to provide a meaningful insight into the dynamics of change in the composition, growth and structure of various manufacturing industries in terms of output, value added, employment, capital formation and a host of other parameters. It provides valuable input to the National Accounts Statistics at national and state level. The results are prepared at state and major industry level. ASI 2022-23 results along with write-up are available in the website of the Ministry ( https://www.mospi.gov.in ). Key highlights from the ASI 2022-23 results The value of some key parameters from ASI 2018-19 to ASI 2022-23 in current prices is given in the table 1. Table 1: Value of a few key parameters from ASI 2018-19 to 2022-23 in current prices (Value figures are in Rupees Lakh) Year 2018-19 2019-20 2020-21 2021-22 2022-23 Fixed Capital 34,66,06,975 36,41,35,165 36,94,38,562 37,26,35,444 41,21,79,458 Invested Capital 47,77,26,474 49,73,62,352 51,91,14,310 55,44,93,175 61,39,21,255 Total Persons Engaged (No.) 1,62,80,211 1,66,24,291 1,60,89,700 1,72,15,350 1,84,94,962 Total Emoluments 4,62,07,983 4,91,72,897 4,83,89,031 5,60,82,801 6,40,49,070 Input 77,43,77,980 74,97,55,617 71,92,06,541 98,79,17,996 1,22,89,54,623 Output 92,81,79,908 89,83,30,129 88,09,21,387 1,19,27,15,147 1,44,86,60,228 GVA 15,38,01,928 14,85,74,512 16,17,14,846 20,47,97,151 21,97,05,605 Depreciation 2,61,55,291 2,73,09,742 2,81,35,986 2,99,64,685 3,16,64,493 NVA 12,76,46,637 12,12,64,771 13,35,78,860 17,48,32,466 18,80,41,113 The value of some Structural Ratios & Technical Co-efficients from ASI 2018-19 to ASI 2022-23 in current prices is given in the table 2. Table 2: Structural Ratios & Technical Co-efficients for last 5 years Year (ASI) Unit 2018-19 2019-20 2020-21 2021-22 2022-23 Structural Ratios Fixed Capital per Factory in operation Rs Lakhs 1,758 1,833 1,844 1,858 1,996 Gross Output per Factory in operation Rs Lakhs 4,708 4,523 4,396 5,946 7,015 Net Value Added per Factory in operation Rs Lakhs 647 611 667 872 911 Workers per Factory in operation Number 65 66 63 68 71 Total Persons Engaged per Factory in operation Number 83 84 80 86 90 Fixed Capital per Persons Engaged Rupees 21,29,008 21,90,380 22,96,118 21,64,553 22,28,604 Output per Worker Rupees 72,52,206 68,79,456 69,94,458 87,63,565 99,10,810 Output per Persons Engaged Rupees 57,01,277 54,03,720 54,75,064 69,28,207 78,32,729 Net Value Added per Worker Rupees 9,97,349 9,28,652 10,60,607 12,84,595 12,86,457 Net Value Added per Persons Engaged Rupees 7,84,060 7,29,443 8,30,213 10,15,561 10,16,715 Gross Value Added per Persons Engaged Rupees 9,44,717 8,93,719 10,05,083 11,89,619 11,87,921 Emoluments per Persons Engaged Rupees 2,83,829 2,95,789 3,00,745 3,25,772 3,46,305 Wages per Worker Rupees 1,68,581 1,75,297 1,76,755 1,94,387 2,05,175 Technical Co-efficients Fixed Capital to NVA 2.72 3.00 2.77 2.13 2.19 Fixed Capital to Output 0.37 0.41 0.42 0.31 0.28 NVA to Output 0.14 0.13 0.15 0.15 0.13 GVA to Fixed Capital 0.44 0.41 0.44 0.55 0.53 Output to Input 1.20 1.20 1.22 1.21 1.18 Emoluments to NVA 0.36 0.41 0.36 0.32 0.34 Contract Workers to Total Workers 0.38 0.38 0.39 0.40 0.41 Table 3: Top Industries For a few important characteristics, top five industries (2-digit level of NIC) at all-India level having major percentage shares in the estimated value of overall aggregate are mentioned in the table below: Rank Characteristics Total no. of Factories Fixed Capital Total Persons Engaged Output Gross Value Added (GVA) 1 Food products (15.99%) Basic Metals (17.59%) Food Products (11.44%) Basic Metals (14.86%) Basic Metals (11.57%) 2 Other Non-Metallic Mineral Products (11.57%) Coke & Refined Petroleum Products (14.18%) Textiles (9.31%) Coke & Refined Petroleum Products (14.02%) Chemicals & Chemical Products (9.83%) 3 Textiles (7.15%) Other Industries (10.11%) Basic Metals (7.63%) Food Products (12.36%) Coke & Refined Petroleum Products (8.70%) 4 Fabricated metal products, (6.79%) Chemicals & Chemical Products (9.71%) Wearing Apparel (7.14%) Chemicals & Chemical Products (9.08%) Motor Vehicles, Trailers & Semi-Trailers (8.07%) 5 Rubber and plastics products (6.07%) Food products (7.28%) Motor Vehicles, Trailers & Semi-Trailers (6.84%) Motor Vehicles, Trailers & Semi-Trailers (7.82%) Pharmaceuticals, Medicinal Chemical and Botanical Products (7.34%) Aggregate Total (all-industries)* 2,53,334 41,21,79,458 1,84,94,962 1,44,86,60,228 21,97,05,605 (* Estimates of Fixed Capital, Output and GVA are in Lakh) Table 4: Top States Top five states in terms of their percentage shares in the value of overall aggregates for each of the characteristics as under: Rank Characteristics Total no. of factories Fixed Capital Total Persons Engaged Output Gross Value Added (GVA) 1 Tamil Nadu (15.66%) Gujarat (19.64%) Tamil Nadu (15.00%) Gujarat (17.72%) Maharashtra (16.33%) 2 Gujarat (12.25%) Maharashtra (11.97%) Maharashtra (12.84%) Maharashtra (14.65%) Gujarat (14.78%) 3 Maharashtra (10.44%) Odisha (8.06%) Gujarat (12.62%) Tamil Nadu (9.97%) Tamil Nadu (10.33%) 4 Uttar Pradesh (7.54%) Tamil Nadu (7.93%) Uttar Pradesh (8.04%) Uttar Pradesh (7.03%) Karnataka (7.04%) 5 Andhra Pradesh (6.51%) Karnataka (6.10%) Karnataka (6.58%) Karnataka (6.17%) Uttar Pradesh (6.09%) Aggregate Total (all India level)* 2,53,334 41,21,79,458 1,84,94,962 1,44,86,60,228 21,97,05,605 (* Estimates of Fixed Capital, Output and GVA are in Lakh) Visualizations from the ASI 2022-23 Results Chart-1: Waterfall chart showing change in absolute value (in ₹ Lakh) in a few important parameters from 2021-22 to 2022-23: All –India Chart-2: Tree map showing Top 10 industries account for 72% of Manufacturing GVA Chart-3: Bar chart showing the manufacturing employment by major sub-sectors in 2022-23 Endnote: A brief note about the Annual Survey of Industries (ASI) 2022-23 The Annual Survey of Industries broadly covers the following The ASI frame is based on the lists of registered factory / units maintained by the Chief Inspector of Factories (CIF) in each State and those maintained by registration authorities in respect of Bidi and Cigar establishments and electricity undertakings. The frame is being revised and updated periodically by the Regional Offices of the Field Operations Division of NSSO in consultation with the Chief Inspector of Factories in the State. At the time of revision, the names of the de-registered factories are removed from the ASI frame and those of the newly registered factories are added. For the units selected in the last survey year (in this case 2021-22), relevant fields like Status Code, Frame industry (NIC 4 digit), Employee (Total persons engaged), Address etc. of frame for a given year, say, ASI 2022-23 are auto-updated dynamically based on the information collected during the last survey year. The primary unit of enumeration in the survey is a factory in the case of manufacturing industries, a workshop in the case of repair services, an undertaking or a licensee in the case of electricity, gas & water supply undertakings and an establishment in the case of bidi & cigar industries. The owner of two or more establishments located in the same State and pertaining to the same industry group and belonging to census scheme is, however, permitted to furnish a single consolidated return. Such consolidated returns are common feature in the case of bidi and cigar establishments, electricity and certain public sector undertakings. According to the sampling design followed in ASI 2022-23, all the units in the updated frame are divided into two parts – Central Sample and State Sample. The Central Sample consists of two schemes: Census and Sample. Under Census scheme, all the units are surveyed. Census Scheme consists of the following: (i) All industrial units belonging to the nine less industrially developed States/ UTs viz. Arunachal Pradesh, Manipur, Meghalaya, Nagaland, Sikkim, Tripura, Mizoram, Andaman & Nicobar Islands and Ladakh. (ii) All industrial units with Frame NIC = 0893 (Salt Extraction). (iii) For the States/ UTs other than those mentioned in (i) and (ii), (iv) All factories covered under ‘Joint Return’ (JR), where JR is allowed when the two or more units located in the same State/UT, same sector and belong to the same industry (3-digit level of NIC-2008) under the same management. (v) After excluding the Census Scheme units in the above manner, all units belonging to the strata ( State x District x Sector x 3-digit NIC-2008 ) having less than or equal to 4 units are also considered under Census Scheme. It may be noted that strata are separately formed under three sectors considered as Bidi, Manufacturing and Electricity . (vi) All the remaining units in the frame are considered under Sample Scheme . For all the states, each stratum is formed on the basis of State x District x Sector x 3-digit NIC-2008 . The units are arranged in descending order of their total number of employees. Samples are drawn using Circular Systematic Sampling technique for this scheme. An even number of units with a minimum of 4 units are selected and distributed in four sub-samples. It may be noted that in certain cases each of 4 sub-samples from a particular stratum may not have equal number of units. (vii) Out of these 4 sub-samples, two pre-assigned sub-samples are given to NSSO (FOD) and the other two-subsamples are given to State/UT for data collection. (viii) The entire census units plus all the units belonging to the two sub-samples given to NSSO (FOD) are treated as the Central Sample . (ix) The entire census units plus all the units belonging to the two sub-samples given to State/UT are treated as the State Sample . (x) The entire census units plus all the units belonging to the two sub-samples given to NSSO (FOD) plus all the units belonging to the two sub-samples given to State/UT are required for pooling of Central Sample and State Sample. It may be noted that samples were drawn considering an average sampling fraction for the sample sector as 8%. The size of the live frame for ASI 2022-23 containing units with status ‘open’, ‘Existing with fixed assets and maintaining staff but not having production’ or ‘Existing with fixed assets but not maintaining staff and not having production’, was 2,55,244. Total sample size for Central sample in ASI 2022-23 was 82,734 (62,778 Census and 19,956 Sample). For further details please refer to the website of the Ministry https://www.mospi.gov.in . Reference Year for ASI 2022-23 is the accounting year of the factory ending on 31 st March 2023. Factory is one that is registered under sections 2m (i) and 2m (ii) of the Factories Act, 1948. The sections 2m (i) and 2m (ii) refer to any premises including the precincts thereof (a) whereon ten or more workers are working, or were working on any day of the preceding twelve months, and in any part of which a manufacturing process is being carried on with the aid of power, or is ordinarily so carried on; or (b) whereon twenty or more workers are working or were working on any day of the preceding twelve months, and in any part of which a manufacturing process is being carried on without the aid of power, or is ordinarily so carried on. Fixed Capital represents the depreciated value of fixed assets owned by the factory as on the closing day of the accounting year. Fixed assets are those that have a normal productive life of more than one year. Fixed capital includes land including lease- hold land, buildings, plant & machinery, furniture and fixtures, transport equipment, water system and roadways and other fixed assets such as hospitals, schools, etc. used for the benefit of the factory personnel. Physical Working Capital is the total inventories comprising of raw materials and components, fuels and lubricants, spares, stores and others, semi-finished goods and finished goods as on the closing day of the accounting year. However, it does not include the stock of the materials, fuels, stores, etc. supplied by others to the factory for processing and finished goods processed by the factory from raw materials supplied by others. Invested Capital is the total of fixed capital and physical working capital as defined above. Workers are defined to include all persons employed directly or through any agency whether for wages or not and engaged in any manufacturing process or in cleaning any part of the machinery or premises used for manufacturing process or in any other kind of work incidental to or connected with the manufacturing process or the subject of the manufacturing process. Labour engaged in the repair & maintenance, or production of fixed assets for factory's own use, or employed for generating electricity, or producing coal, gas etc. are included. Employees include all workers defined above and persons receiving wages and holding clerical or supervisory or managerial positions engaged in administrative office, store keeping section and welfare section, sales department as also those engaged in purchase of raw materials etc. or purchase of fixed assets for the factory as well as watch and ward staff. Total Persons Engaged include the employees as defined above and all working proprietors and their family members who are actively engaged in the work of the factory even without any pay, and the unpaid members of the co-operative societies who worked in or for the factory in any direct and productive capacity. The number of workers or employees is an average number obtained by dividing mandays worked by the number of days the factory had worked during the reference year. Wages and Salaries are defined to include all remuneration in monetary terms and also payable more or less regularly in each pay period to workers as compensation for work done during the accounting year. It includes (a) direct wages and salary (i.e., basic wages/salaries, payment of overtime, dearness, compensatory allowance, house rent and other allowances), (b) remuneration for the period not worked (i.e., basic wages, salaries and allowances payable for leave period, paid holiday, lay-off payments and compensation for unemployment, if not paid from sources other than employers), (c) bonuses and ex-gratia payment paid both at regular and less frequent intervals (i.e., incentive bonuses, good attendance bonuses, productive bonuses, profit sharing bonuses, festival or year-end bonuses, etc.). It excludes lay off payments which are made from trust or other special funds set up exclusively for this purpose i.e., payments not made by the employer. It also excludes imputed value of benefits in kind, employer's contribution to old age benefits and other social security charges, direct expenditure on maternity benefits and crèches and other group benefits. Travelling and other expenditure incurred for business purposes and reimbursed by the employer are excluded. The wages are expressed in terms of gross value i.e., before deduction for fines, damages, taxes, provident fund, employee's state insurance contribution, etc. Contribution to Provident Fund and Other Funds includes old age benefits like provident fund, pension, gratuity, etc. and employers contribution towards other social security charges such as employees state insurance, compensation for work injuries and occupational diseases, provident fund-linked insurance, retrenchment and lay- off benefits. Workmen and Staff Welfare Expenses include group benefits like direct expenditure on maternity, crèches, canteen facilities, educational, cultural and recreational facilities; and grants to trade unions , co-operative stores, etc. meant for employees. Total Emoluments is defined as the sum of wages and salaries including bonus. Input comprises total value of fuels and materials consumed as well as expenditures such as cost of contract and commission work done by others on materials supplied by the factory, cost of materials consumed for repair and maintenance of factory's fixed assets including cost of repairs and maintenance work done by others to the factory's fixed assets, rent paid for buildings and plant & machinery and other fixed assets , inward freight and transport charges, rates and taxes (excluding income tax), postage, telephone and telex expenses, banking charges, cost of printing and stationery, R&D expenses, expenses on raw materials and other components for own construction and purchase value of goods sold in the same condition as purchased . Output comprises total ex-factory value of products and by-products manufactured as well as other receipts such as receipts from manufacturing and non-industrial services rendered to others, work done for others on material supplied by them, value of electricity produced and sold, rent received for building , plant & machinery and other fixed assets , sale value of goods sold in the same condition as purchased, addition in stock of semi- finished goods, value of own construction and an amount equal to expenses on research & development (R&D) . Depreciation is consumption of fixed capital due to wear & tear and obsolescence during the accounting year and is taken as provided by the factory owner or is estimated on the basis of cost of installation and working life of the fixed assets. Gross Value Added (GVA) is defined as additional value created by the process of production. This is calculated by deducting the value of total input from total output. Net Value Added (NVA) is arrived by deducting total input and depreciation from total output. Data for ASI are collected from the selected factories under the Collection of Statistics Act 2008 as amended in 2017 and Rules framed there under in 2011. The entire survey is conducted through a dedicated web-portal without any paper schedule. For data collection in ASI, an establishment (and not enterprise) approach is followed wherein data are collected from the selected establishments. Various quality checks are carried out on the data collected through this survey which is primarily record- based. Relative Standard Errors (RSE) (which is a widely accepted statistical measure of reliability of an estimate) for important parameters estimated from the survey at an overall level are small and well within the acceptable range. However, since the data presented in this result are estimated from sample survey, necessary caution may be taken while using this data (for details please refer to the website of the Ministry https://www.mospi.gov.in ). **** SB/DP Introduction Ministry of Statistics and Programme Implementation (MoSPI) has released the results of Annual Survey of Industries (ASI) for the reference periods April 2022 to March 2023 (i.e. financial year 2022-23) referred to as ASI 2022-23 in this press note. The field work for this survey was carried out during November 2023 to June 2024 for ASI 2022-23. A brief note about the survey ASI 2022-23 is given at the Endnote. Annual Survey of Industries is conducted with the primary objective to provide a meaningful insight into the dynamics of change in the composition, growth and structure of various manufacturing industries in terms of output, value added, employment, capital formation and a host of other parameters. It provides valuable input to the National Accounts Statistics at national and state level. The results are prepared at state and major industry level. ASI 2022-23 results along with write-up are available in the website of the Ministry ( https://www.mospi.gov.in ). Key highlights from the ASI 2022-23 results The value of some key parameters from ASI 2018-19 to ASI 2022-23 in current prices is given in the table 1. Table 1: Value of a few key parameters from ASI 2018-19 to 2022-23 in current prices (Value figures are in Rupees Lakh) Year 2018-19 2019-20 2020-21 2021-22 2022-23 Fixed Capital 34,66,06,975 36,41,35,165 36,94,38,562 37,26,35,444 41,21,79,458 Invested Capital 47,77,26,474 49,73,62,352 51,91,14,310 55,44,93,175 61,39,21,255 Total Persons Engaged (No.) 1,62,80,211 1,66,24,291 1,60,89,700 1,72,15,350 1,84,94,962 Total Emoluments 4,62,07,983 4,91,72,897 4,83,89,031 5,60,82,801 6,40,49,070 Input 77,43,77,980 74,97,55,617 71,92,06,541 98,79,17,996 1,22,89,54,623 Output 92,81,79,908 89,83,30,129 88,09,21,387 1,19,27,15,147 1,44,86,60,228 GVA 15,38,01,928 14,85,74,512 16,17,14,846 20,47,97,151 21,97,05,605 Depreciation 2,61,55,291 2,73,09,742 2,81,35,986 2,99,64,685 3,16,64,493 NVA 12,76,46,637 12,12,64,771 13,35,78,860 17,48,32,466 18,80,41,113 The value of some Structural Ratios & Technical Co-efficients from ASI 2018-19 to ASI 2022-23 in current prices is given in the table 2. Table 2: Structural Ratios & Technical Co-efficients for last 5 years Year (ASI) Unit 2018-19 2019-20 2020-21 2021-22 2022-23 Structural Ratios Fixed Capital per Factory in operation Rs Lakhs 1,758 1,833 1,844 1,858 1,996 Gross Output per Factory in operation Rs Lakhs 4,708 4,523 4,396 5,946 7,015 Net Value Added per Factory in operation Rs Lakhs 647 611 667 872 911 Workers per Factory in operation Number 65 66 63 68 71 Total Persons Engaged per Factory in operation Number 83 84 80 86 90 Fixed Capital per Persons Engaged Rupees 21,29,008 21,90,380 22,96,118 21,64,553 22,28,604 Output per Worker Rupees 72,52,206 68,79,456 69,94,458 87,63,565 99,10,810 Output per Persons Engaged Rupees 57,01,277 54,03,720 54,75,064 69,28,207 78,32,729 Net Value Added per Worker Rupees 9,97,349 9,28,652 10,60,607 12,84,595 12,86,457 Net Value Added per Persons Engaged Rupees 7,84,060 7,29,443 8,30,213 10,15,561 10,16,715 Gross Value Added per Persons Engaged Rupees 9,44,717 8,93,719 10,05,083 11,89,619 11,87,921 Emoluments per Persons Engaged Rupees 2,83,829 2,95,789 3,00,745 3,25,772 3,46,305 Wages per Worker Rupees 1,68,581 1,75,297 1,76,755 1,94,387 2,05,175 Technical Co-efficients Fixed Capital to NVA 2.72 3.00 2.77 2.13 2.19 Fixed Capital to Output 0.37 0.41 0.42 0.31 0.28 NVA to Output 0.14 0.13 0.15 0.15 0.13 GVA to Fixed Capital 0.44 0.41 0.44 0.55 0.53 Output to Input 1.20 1.20 1.22 1.21 1.18 Emoluments to NVA 0.36 0.41 0.36 0.32 0.34 Contract Workers to Total Workers 0.38 0.38 0.39 0.40 0.41 Table 3: Top Industries For a few important characteristics, top five industries (2-digit level of NIC) at all-India level having major percentage shares in the estimated value of overall aggregate are mentioned in the table below: Rank Characteristics Total no. of Factories Fixed Capital Total Persons Engaged Output Gross Value Added (GVA) 1 Food products (15.99%) Basic Metals (17.59%) Food Products (11.44%) Basic Metals (14.86%) Basic Metals (11.57%) 2 Other Non-Metallic Mineral Products (11.57%) Coke & Refined Petroleum Products (14.18%) Textiles (9.31%) Coke & Refined Petroleum Products (14.02%) Chemicals & Chemical Products (9.83%) 3 Textiles (7.15%) Other Industries (10.11%) Basic Metals (7.63%) Food Products (12.36%) Coke & Refined Petroleum Products (8.70%) 4 Fabricated metal products, (6.79%) Chemicals & Chemical Products (9.71%) Wearing Apparel (7.14%) Chemicals & Chemical Products (9.08%) Motor Vehicles, Trailers & Semi-Trailers (8.07%) 5 Rubber and plastics products (6.07%) Food products (7.28%) Motor Vehicles, Trailers & Semi-Trailers (6.84%) Motor Vehicles, Trailers & Semi-Trailers (7.82%) Pharmaceuticals, Medicinal Chemical and Botanical Products (7.34%) Aggregate Total (all-industries)* 2,53,334 41,21,79,458 1,84,94,962 1,44,86,60,228 21,97,05,605 (* Estimates of Fixed Capital, Output and GVA are in Lakh) Table 4: Top States Top five states in terms of their percentage shares in the value of overall aggregates for each of the characteristics as under: Rank Characteristics Total no. of factories Fixed Capital Total Persons Engaged Output Gross Value Added (GVA) 1 Tamil Nadu (15.66%) Gujarat (19.64%) Tamil Nadu (15.00%) Gujarat (17.72%) Maharashtra (16.33%) 2 Gujarat (12.25%) Maharashtra (11.97%) Maharashtra (12.84%) Maharashtra (14.65%) Gujarat (14.78%) 3 Maharashtra (10.44%) Odisha (8.06%) Gujarat (12.62%) Tamil Nadu (9.97%) Tamil Nadu (10.33%) 4 Uttar Pradesh (7.54%) Tamil Nadu (7.93%) Uttar Pradesh (8.04%) Uttar Pradesh (7.03%) Karnataka (7.04%) 5 Andhra Pradesh (6.51%) Karnataka (6.10%) Karnataka (6.58%) Karnataka (6.17%) Uttar Pradesh (6.09%) Aggregate Total (all India level)* 2,53,334 41,21,79,458 1,84,94,962 1,44,86,60,228 21,97,05,605 (* Estimates of Fixed Capital, Output and GVA are in Lakh) Visualizations from the ASI 2022-23 Results Chart-1: Waterfall chart showing change in absolute value (in ₹ Lakh) in a few important parameters from 2021-22 to 2022-23: All –India Chart-2: Tree map showing Top 10 industries account for 72% of Manufacturing GVA Chart-3: Bar chart showing the manufacturing employment by major sub-sectors in 2022-23 Endnote: A brief note about the Annual Survey of Industries (ASI) 2022-23 The Annual Survey of Industries broadly covers the following The ASI frame is based on the lists of registered factory / units maintained by the Chief Inspector of Factories (CIF) in each State and those maintained by registration authorities in respect of Bidi and Cigar establishments and electricity undertakings. The frame is being revised and updated periodically by the Regional Offices of the Field Operations Division of NSSO in consultation with the Chief Inspector of Factories in the State. At the time of revision, the names of the de-registered factories are removed from the ASI frame and those of the newly registered factories are added. For the units selected in the last survey year (in this case 2021-22), relevant fields like Status Code, Frame industry (NIC 4 digit), Employee (Total persons engaged), Address etc. of frame for a given year, say, ASI 2022-23 are auto-updated dynamically based on the information collected during the last survey year. The primary unit of enumeration in the survey is a factory in the case of manufacturing industries, a workshop in the case of repair services, an undertaking or a licensee in the case of electricity, gas & water supply undertakings and an establishment in the case of bidi & cigar industries. The owner of two or more establishments located in the same State and pertaining to the same industry group and belonging to census scheme is, however, permitted to furnish a single consolidated return. Such consolidated returns are common feature in the case of bidi and cigar establishments, electricity and certain public sector undertakings. According to the sampling design followed in ASI 2022-23, all the units in the updated frame are divided into two parts – Central Sample and State Sample. The Central Sample consists of two schemes: Census and Sample. Under Census scheme, all the units are surveyed. Census Scheme consists of the following: (i) All industrial units belonging to the nine less industrially developed States/ UTs viz. Arunachal Pradesh, Manipur, Meghalaya, Nagaland, Sikkim, Tripura, Mizoram, Andaman & Nicobar Islands and Ladakh. (ii) All industrial units with Frame NIC = 0893 (Salt Extraction). (iii) For the States/ UTs other than those mentioned in (i) and (ii), (iv) All factories covered under ‘Joint Return’ (JR), where JR is allowed when the two or more units located in the same State/UT, same sector and belong to the same industry (3-digit level of NIC-2008) under the same management. (v) After excluding the Census Scheme units in the above manner, all units belonging to the strata ( State x District x Sector x 3-digit NIC-2008 ) having less than or equal to 4 units are also considered under Census Scheme. It may be noted that strata are separately formed under three sectors considered as Bidi, Manufacturing and Electricity . (vi) All the remaining units in the frame are considered under Sample Scheme . For all the states, each stratum is formed on the basis of State x District x Sector x 3-digit NIC-2008 . The units are arranged in descending order of their total number of employees. Samples are drawn using Circular Systematic Sampling technique for this scheme. An even number of units with a minimum of 4 units are selected and distributed in four sub-samples. It may be noted that in certain cases each of 4 sub-samples from a particular stratum may not have equal number of units. (vii) Out of these 4 sub-samples, two pre-assigned sub-samples are given to NSSO (FOD) and the other two-subsamples are given to State/UT for data collection. (viii) The entire census units plus all the units belonging to the two sub-samples given to NSSO (FOD) are treated as the Central Sample . (ix) The entire census units plus all the units belonging to the two sub-samples given to State/UT are treated as the State Sample . (x) The entire census units plus all the units belonging to the two sub-samples given to NSSO (FOD) plus all the units belonging to the two sub-samples given to State/UT are required for pooling of Central Sample and State Sample. It may be noted that samples were drawn considering an average sampling fraction for the sample sector as 8%. The size of the live frame for ASI 2022-23 containing units with status ‘open’, ‘Existing with fixed assets and maintaining staff but not having production’ or ‘Existing with fixed assets but not maintaining staff and not having production’, was 2,55,244. Total sample size for Central sample in ASI 2022-23 was 82,734 (62,778 Census and 19,956 Sample). For further details please refer to the website of the Ministry https://www.mospi.gov.in . Reference Year for ASI 2022-23 is the accounting year of the factory ending on 31 st March 2023. Factory is one that is registered under sections 2m (i) and 2m (ii) of the Factories Act, 1948. The sections 2m (i) and 2m (ii) refer to any premises including the precincts thereof (a) whereon ten or more workers are working, or were working on any day of the preceding twelve months, and in any part of which a manufacturing process is being carried on with the aid of power, or is ordinarily so carried on; or (b) whereon twenty or more workers are working or were working on any day of the preceding twelve months, and in any part of which a manufacturing process is being carried on without the aid of power, or is ordinarily so carried on. Fixed Capital represents the depreciated value of fixed assets owned by the factory as on the closing day of the accounting year. Fixed assets are those that have a normal productive life of more than one year. Fixed capital includes land including lease- hold land, buildings, plant & machinery, furniture and fixtures, transport equipment, water system and roadways and other fixed assets such as hospitals, schools, etc. used for the benefit of the factory personnel. Physical Working Capital is the total inventories comprising of raw materials and components, fuels and lubricants, spares, stores and others, semi-finished goods and finished goods as on the closing day of the accounting year. However, it does not include the stock of the materials, fuels, stores, etc. supplied by others to the factory for processing and finished goods processed by the factory from raw materials supplied by others. Invested Capital is the total of fixed capital and physical working capital as defined above. Workers are defined to include all persons employed directly or through any agency whether for wages or not and engaged in any manufacturing process or in cleaning any part of the machinery or premises used for manufacturing process or in any other kind of work incidental to or connected with the manufacturing process or the subject of the manufacturing process. Labour engaged in the repair & maintenance, or production of fixed assets for factory's own use, or employed for generating electricity, or producing coal, gas etc. are included. Employees include all workers defined above and persons receiving wages and holding clerical or supervisory or managerial positions engaged in administrative office, store keeping section and welfare section, sales department as also those engaged in purchase of raw materials etc. or purchase of fixed assets for the factory as well as watch and ward staff. Total Persons Engaged include the employees as defined above and all working proprietors and their family members who are actively engaged in the work of the factory even without any pay, and the unpaid members of the co-operative societies who worked in or for the factory in any direct and productive capacity. The number of workers or employees is an average number obtained by dividing mandays worked by the number of days the factory had worked during the reference year. Wages and Salaries are defined to include all remuneration in monetary terms and also payable more or less regularly in each pay period to workers as compensation for work done during the accounting year. It includes (a) direct wages and salary (i.e., basic wages/salaries, payment of overtime, dearness, compensatory allowance, house rent and other allowances), (b) remuneration for the period not worked (i.e., basic wages, salaries and allowances payable for leave period, paid holiday, lay-off payments and compensation for unemployment, if not paid from sources other than employers), (c) bonuses and ex-gratia payment paid both at regular and less frequent intervals (i.e., incentive bonuses, good attendance bonuses, productive bonuses, profit sharing bonuses, festival or year-end bonuses, etc.). It excludes lay off payments which are made from trust or other special funds set up exclusively for this purpose i.e., payments not made by the employer. It also excludes imputed value of benefits in kind, employer's contribution to old age benefits and other social security charges, direct expenditure on maternity benefits and crèches and other group benefits. Travelling and other expenditure incurred for business purposes and reimbursed by the employer are excluded. The wages are expressed in terms of gross value i.e., before deduction for fines, damages, taxes, provident fund, employee's state insurance contribution, etc. Contribution to Provident Fund and Other Funds includes old age benefits like provident fund, pension, gratuity, etc. and employers contribution towards other social security charges such as employees state insurance, compensation for work injuries and occupational diseases, provident fund-linked insurance, retrenchment and lay- off benefits. Workmen and Staff Welfare Expenses include group benefits like direct expenditure on maternity, crèches, canteen facilities, educational, cultural and recreational facilities; and grants to trade unions , co-operative stores, etc. meant for employees. Total Emoluments is defined as the sum of wages and salaries including bonus. Input comprises total value of fuels and materials consumed as well as expenditures such as cost of contract and commission work done by others on materials supplied by the factory, cost of materials consumed for repair and maintenance of factory's fixed assets including cost of repairs and maintenance work done by others to the factory's fixed assets, rent paid for buildings and plant & machinery and other fixed assets , inward freight and transport charges, rates and taxes (excluding income tax), postage, telephone and telex expenses, banking charges, cost of printing and stationery, R&D expenses, expenses on raw materials and other components for own construction and purchase value of goods sold in the same condition as purchased . Output comprises total ex-factory value of products and by-products manufactured as well as other receipts such as receipts from manufacturing and non-industrial services rendered to others, work done for others on material supplied by them, value of electricity produced and sold, rent received for building , plant & machinery and other fixed assets , sale value of goods sold in the same condition as purchased, addition in stock of semi- finished goods, value of own construction and an amount equal to expenses on research & development (R&D) . Depreciation is consumption of fixed capital due to wear & tear and obsolescence during the accounting year and is taken as provided by the factory owner or is estimated on the basis of cost of installation and working life of the fixed assets. Gross Value Added (GVA) is defined as additional value created by the process of production. This is calculated by deducting the value of total input from total output. Net Value Added (NVA) is arrived by deducting total input and depreciation from total output. Data for ASI are collected from the selected factories under the Collection of Statistics Act 2008 as amended in 2017 and Rules framed there under in 2011. The entire survey is conducted through a dedicated web-portal without any paper schedule. For data collection in ASI, an establishment (and not enterprise) approach is followed wherein data are collected from the selected establishments. Various quality checks are carried out on the data collected through this survey which is primarily record- based. Relative Standard Errors (RSE) (which is a widely accepted statistical measure of reliability of an estimate) for important parameters estimated from the survey at an overall level are small and well within the acceptable range. However, since the data presented in this result are estimated from sample survey, necessary caution may be taken while using this data (for details please refer to the website of the Ministry https://www.mospi.gov.in ). **** SB/DP